The quick numbers
| Price, cap, EV | 6.0c (24 Aug), about A$14.3M, EV about A$10.3M |
| Shares | 238,885,388. Plus 2.76M options at 12c and 6.6M performance rights. Fully diluted 248.2M |
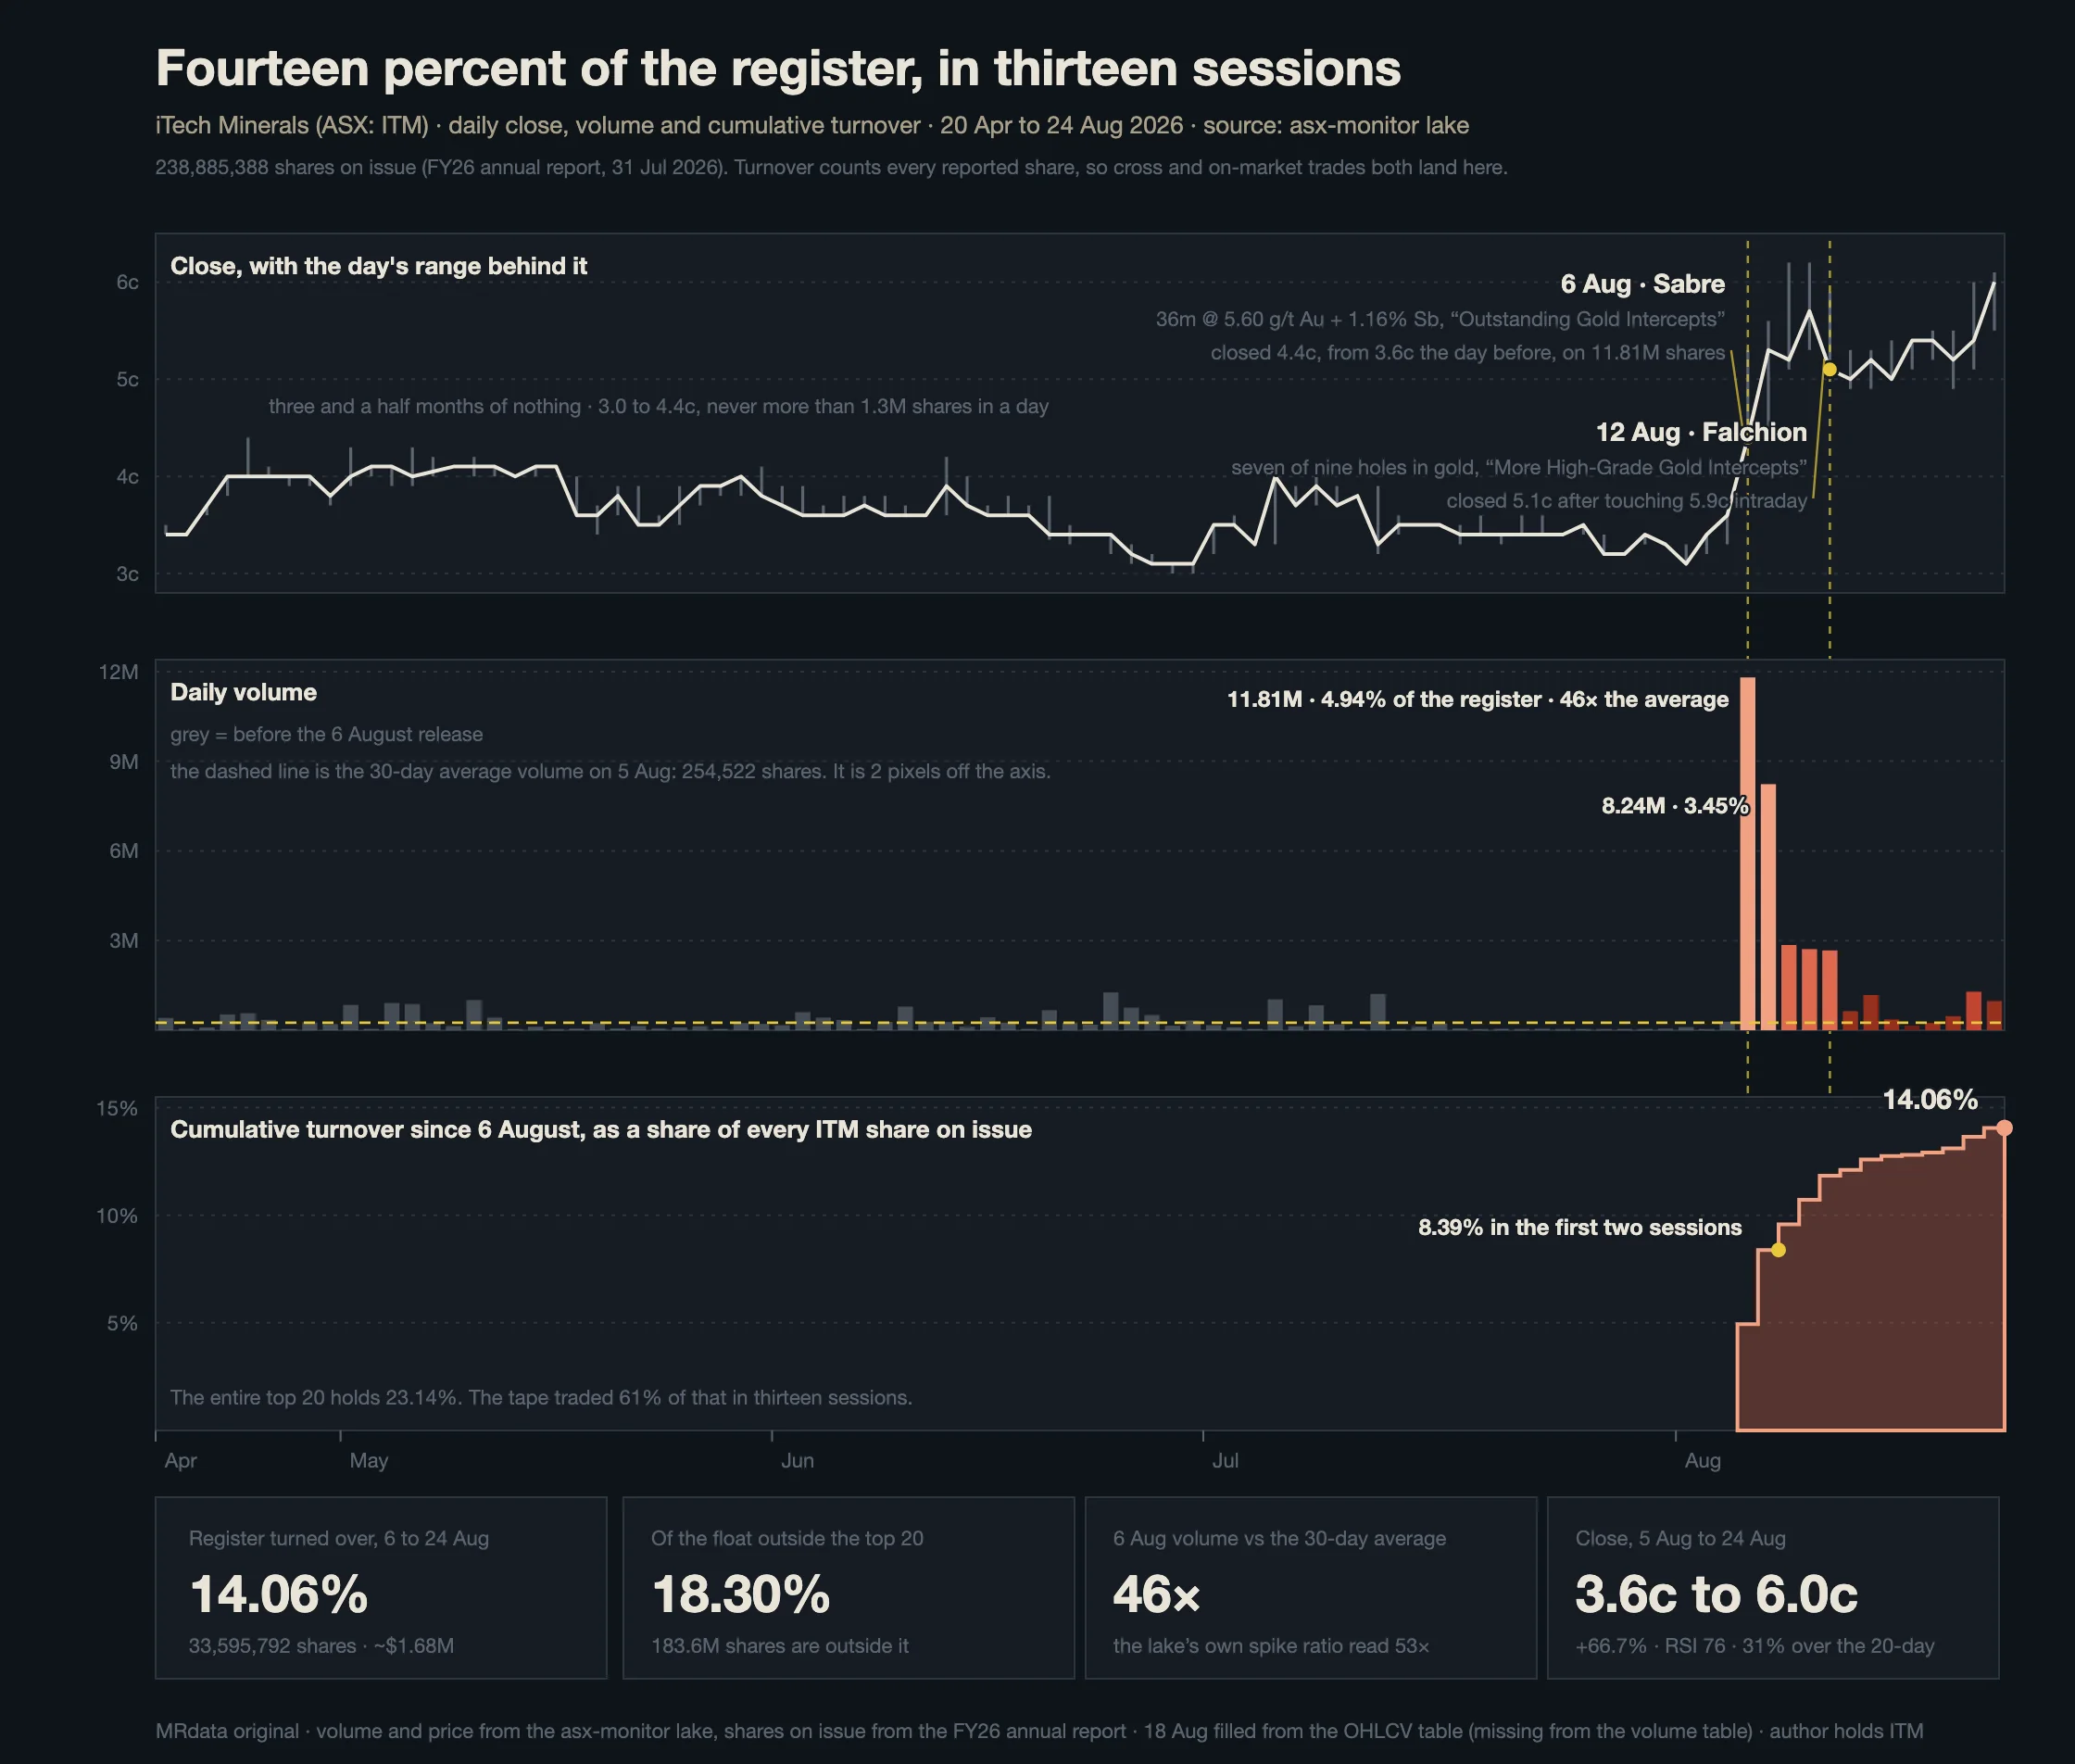
| Turnover since 6 Aug | 33,595,792 shares, 14.06% of the register, in thirteen sessions. About $1.68M of value |
| Volume, 6 Aug | 11.81M shares, 46x the 30-day average, 4.94% of the whole company in one day |
| Register (31 Jul 26) | 7,474 holders. Top 20 hold 23.14%. No substantial shareholders. 6,101 holders, 81.6% of them, own less than $500 of stock |
| Cash | $4,016,194 at 30 June, audited |
| Real burn | About $2.68M FY26 once you strip the $1.9M SQM cheque out of the operating line. That is $671k a quarter, roughly 3x what my own tracker prints |
| Near-term obligation | $1,482,000 minimum exploration spend inside twelve months, against a 56-hole program already in the ground |
| The asset | Reynolds Range, Aileron Province NT. 791 km2, four granted licences, 100% owned |
| The event | About 41 of 56 holes still unreported. September |
The turnover, properly counted
The 6 August release was Sabre: 36m at 5.60 g/t gold with 1.16% antimony, including 14m at 9.4 g/t. The stock closed 6 August at 4.4c, having opened at 4.9c and traded as high as 5.3c, on 11,807,215 shares. The day before, the 30-day average volume was 254,522 shares. So the first day was 46 times normal. The lake's own spike detector, which measures against a slightly different average, printed 53x and tagged it BLOWOUT.
The 7th did 8,235,921 shares and closed at 5.3c. Between those two sessions, 20,043,136 shares changed hands. That is 8.39% of every share on issue, in two days. The 8th was a Saturday, so there is no third day to count, and anyone quoting a three day figure is quoting two sessions and a weekend.
Run it out to 24 August, thirteen sessions, and the total is 33,595,792 shares. 14.06% of the register. Put differently:
- 18.30% of the float that sits outside the top 20, since the top 20 only hold 23.14% and mostly did not trade.
- 132 sessions of pre-event volume, compressed into thirteen.
- The equivalent of 61% of everything the top 20 hold, moving through the market in under three weeks while the top 20 sat still.
- Day one alone traded 1.9 times the largest single line on the register, which is a Citicorp nominee account at 2.54%.
That is the number worth holding onto, because it says something specific about what happened. A 14% turnover in a company with no substantial shareholders and 81.6% of holders below a marketable parcel is not a couple of funds building a position. It is the float itself changing hands. The 31 July register in the annual report is the last clean photograph of the old holders, and it is worth keeping, because whoever owns ITM in the FY27 report is not the same set of people.
One honest gap: 18 August is missing from the lake's volume table and I filled it from the OHLCV table, 156,040 shares. Everything else is as pulled.
The technicals
As at 24 August: close 6.0c, RSI 76, up 20% over five sessions and 71% over twenty, sitting 31% above its own 20-day average and above the 50-day. The momentum module has called it EXTENDED on ten of the twelve sessions it has scored since the release, and UPTREND on the other two. Average volume has gone from 254,522 to 1,165,304, a 4.6x reset, which means the stock now needs four and a half times the old volume just to look normal.
One caveat, and it is mine rather than the company's. The momentum module prints a field called pct_from_high_252 and for ITM it reads minus 11.8%, implying a twelve month high near 6.8c. The lake's own price history for this ticker starts 20 April 2026 and holds 90 sessions. It is not a 252 day number. I am printing it because it is what the tracker says, and flagging it because it is not what the label claims.
What the broker flow shows is worth a paragraph, with two caveats attached: it arrives three days behind the tape, and it only ever reports group aggregates rather than broker names, so none of it can be tied back to a desk.
The largest single group print in the whole series is retail brokers on 7 August, $836,459 of turnover, split 51% buy to 49% sell. A dead heat, which is churn rather than accumulation. On 6 August itself the rows eventually showed resource investors and investment banks both net buying, on $101,766 and $111,566 of turnover. And across the thirteen sessions the only group that turns up repeatedly is investment banks, net buyers on six separate days for a cumulative plus $78,005. Small money against $1.68M of value traded, but it is the one group that kept coming back, and it started on the day of the release rather than before it.
The other thing sitting in the technicals is a date. Those 2.76M options struck at 12c expire on 31 August 2026. At 6.0c they are 100% out of the money and they will lapse. 2.5M of them sit with Foster Stockbroking Nominees. Nothing dramatic, but it is a live overhang that quietly disappears this week.
Two prospects, and eleven holes that decided the year
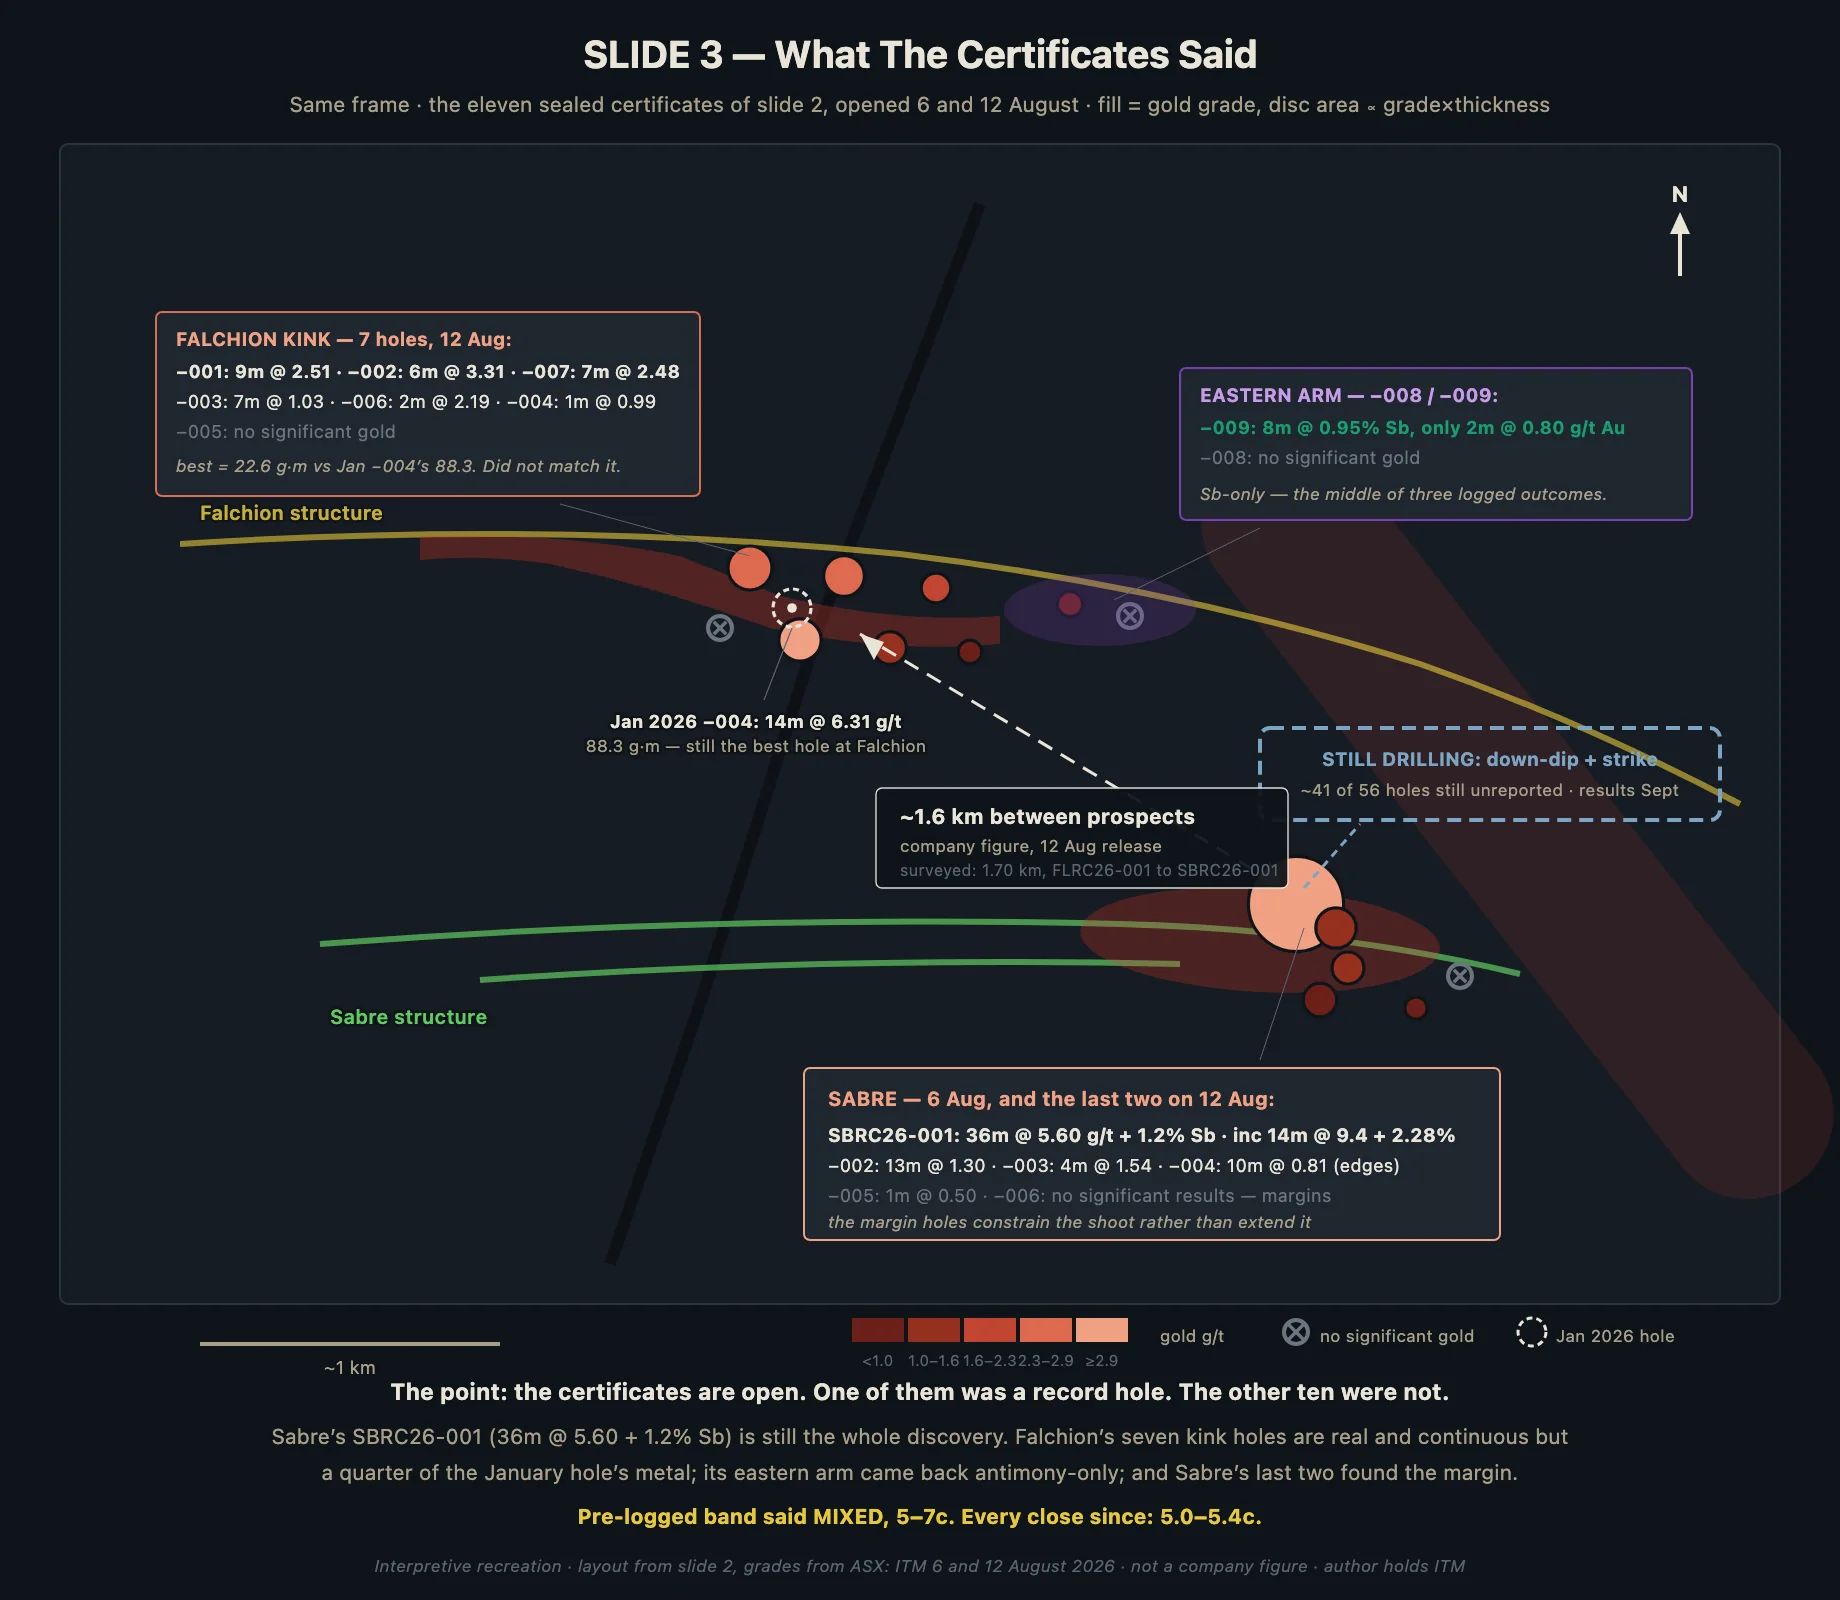
Reynolds Range has two drilled prospects, 1.6 km apart on the company's figure and 1.70 km apart if you measure collar to collar. Everything announced this year came out of eleven holes across the two of them. The single measure I use to compare holes is grade times thickness, metres multiplied by grams per tonne, because it is the only number that does not let a narrow high-grade sliver and a wide low-grade smear pretend to be the same thing.
On that measure the entire company is one hole. SBRC26-001 at Sabre returned 205.5 g.m. The next best hole ever drilled on the project is 97.2. The best hole at Falchion is 88.3 and it was drilled in November 2025.
Sabre
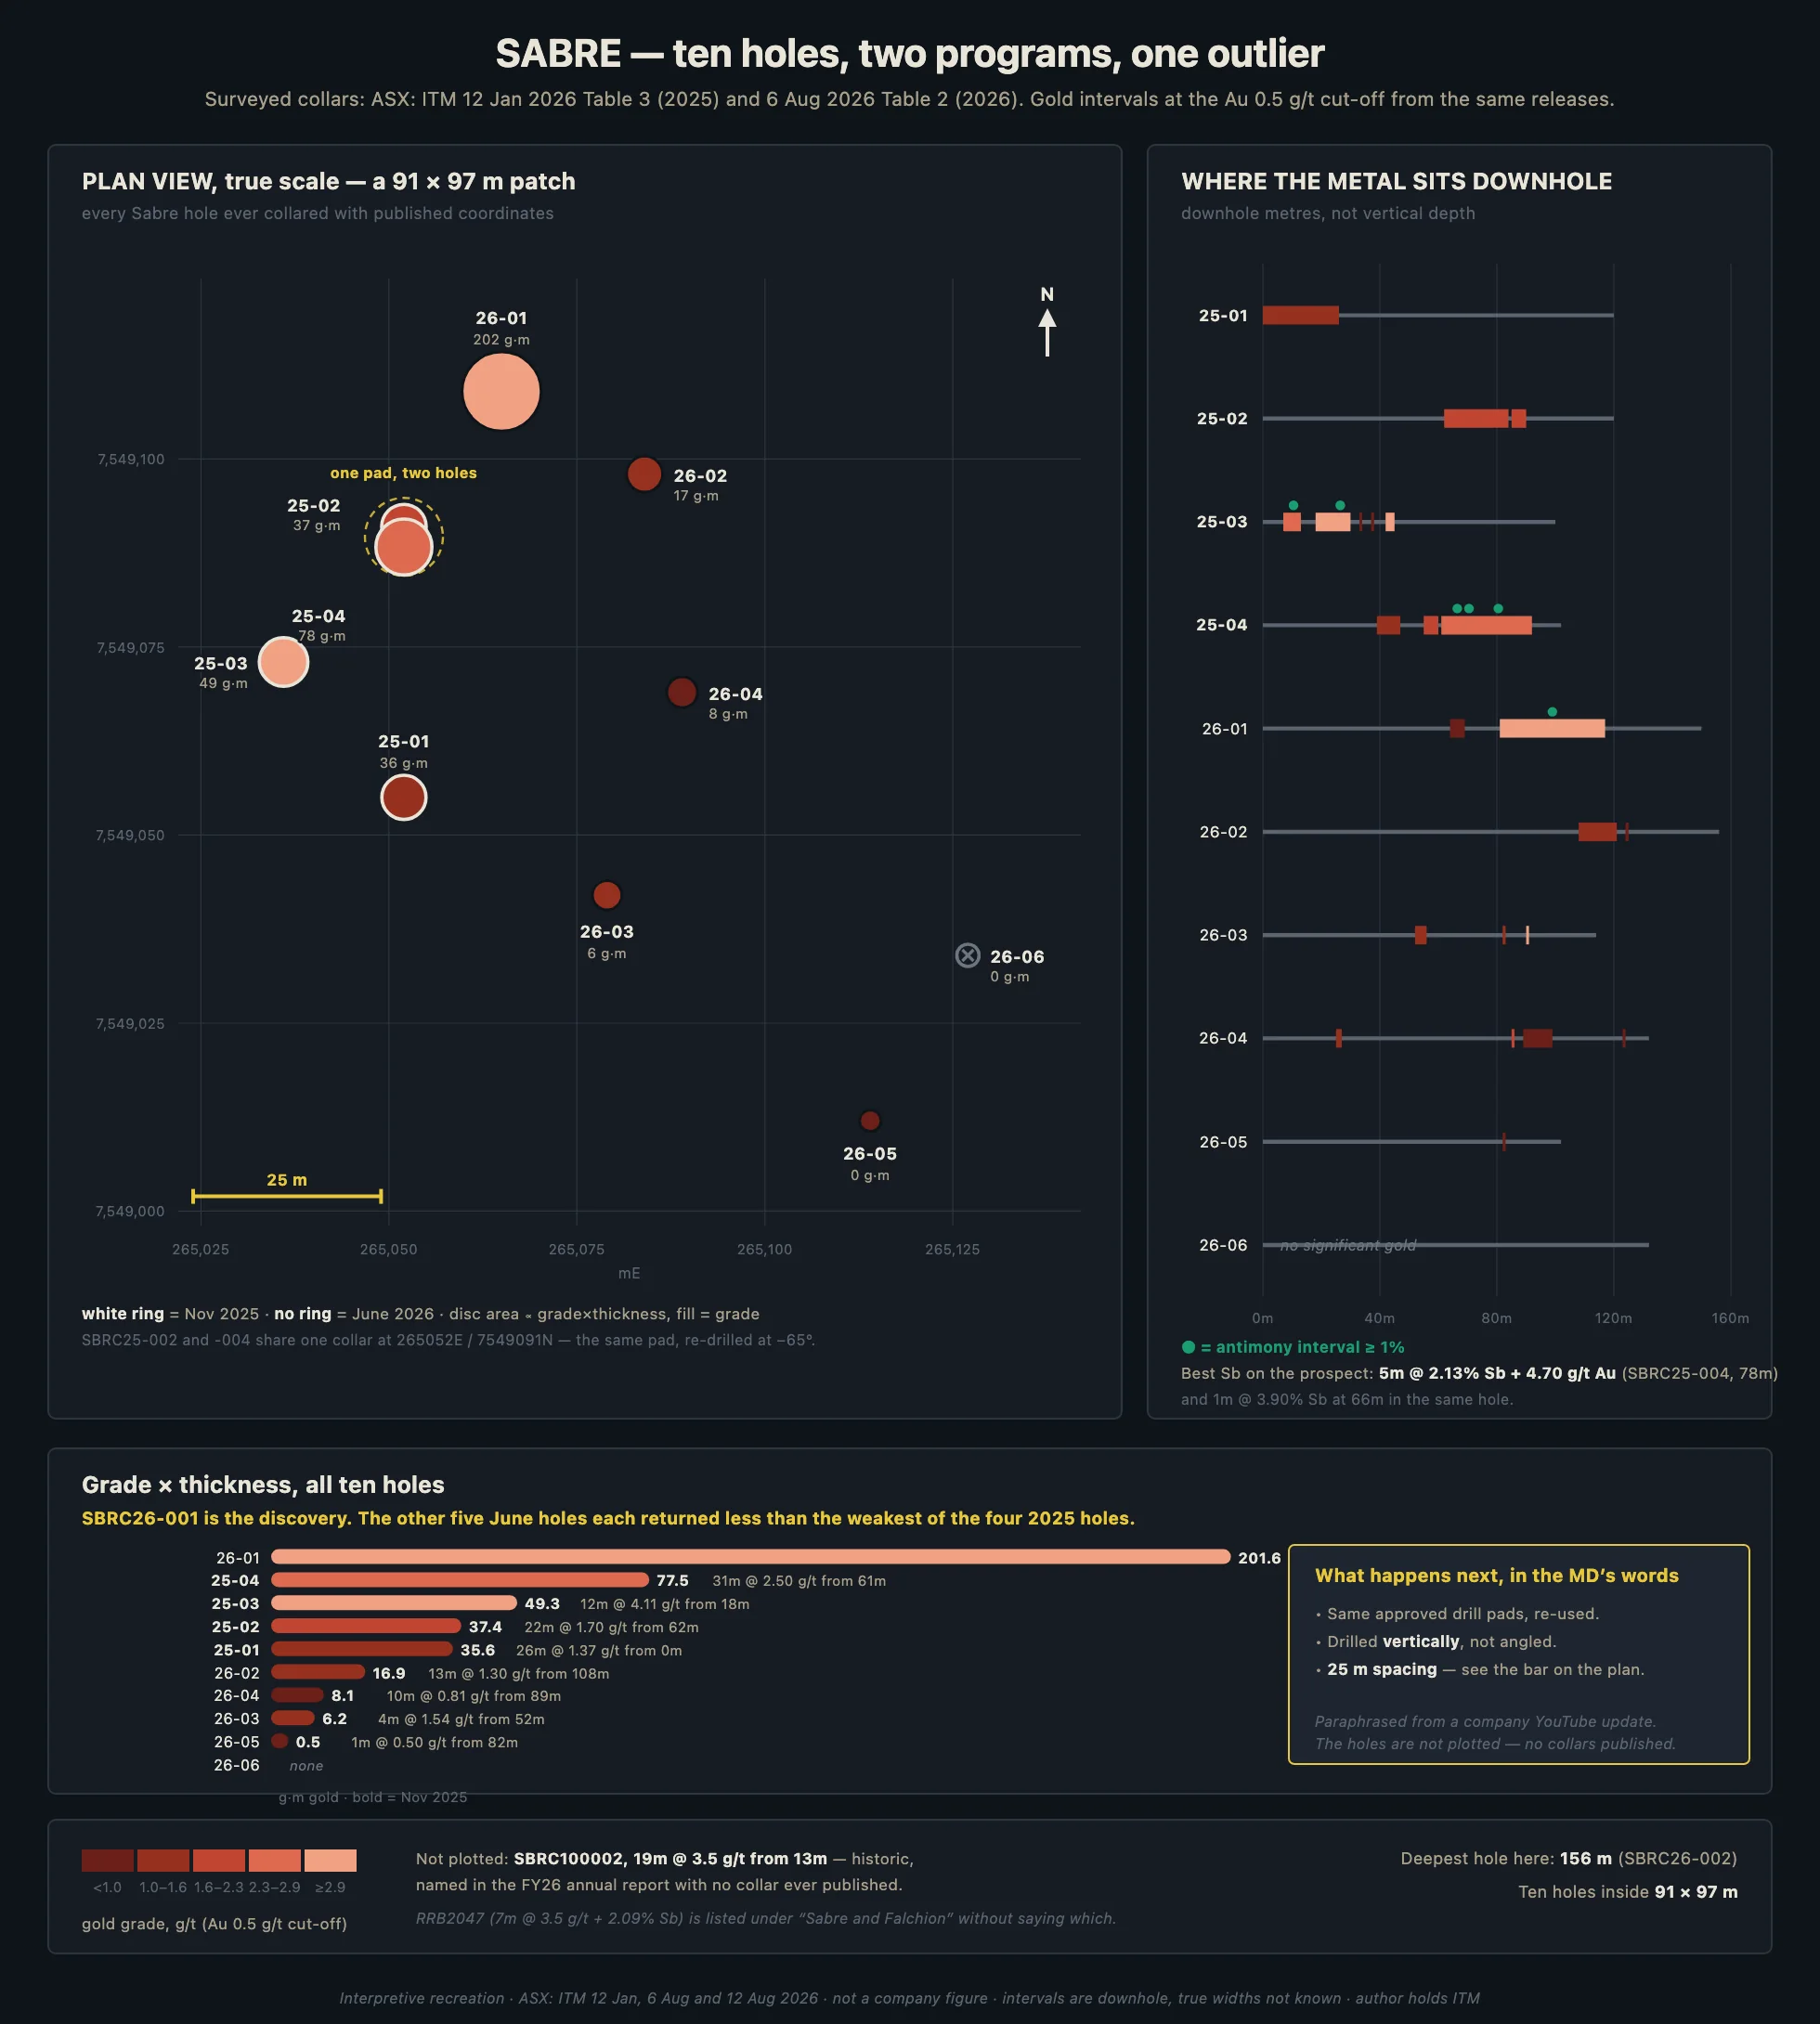
Ten holes have ever been drilled at Sabre. Their collars occupy a patch 91 metres east to west by 97 metres north to south. That is the whole discovery, and it is smaller than a city block.
The June program put six holes in. One of them, SBRC26-001, is the best hole on the project by a factor of two: 36m at 5.60 g/t gold and 1.16% antimony from 81m, with 14m at 9.4 g/t and 2.28% antimony inside it. The other five did progressively less: SBRC26-002 gave 13m at 1.30 from 108m, SBRC26-003 gave 4m at 1.54, SBRC26-004 gave 10m at 0.81, SBRC26-005 gave a single metre at 0.50, and SBRC26-006 returned nothing significant at all.
Read in order that is not a disappointment, it is a shape. The last two holes stepped out to the southeast margin and found the edge. Margin holes that come back barren are doing their job, they constrain the shoot. What they also do is tell you the shoot is small in the direction they went.
The antimony is the part that gets underplayed. Sabre has five reported intervals above a 1% antimony cut-off and every one of them came from the November 2025 holes, plus the antimony riding inside SBRC26-001. Peak grade is 3.90% over a single metre. This is a gold system with an antimony signature, not an antimony deposit, and anybody pricing it on the critical minerals list is pricing the wrong metal.
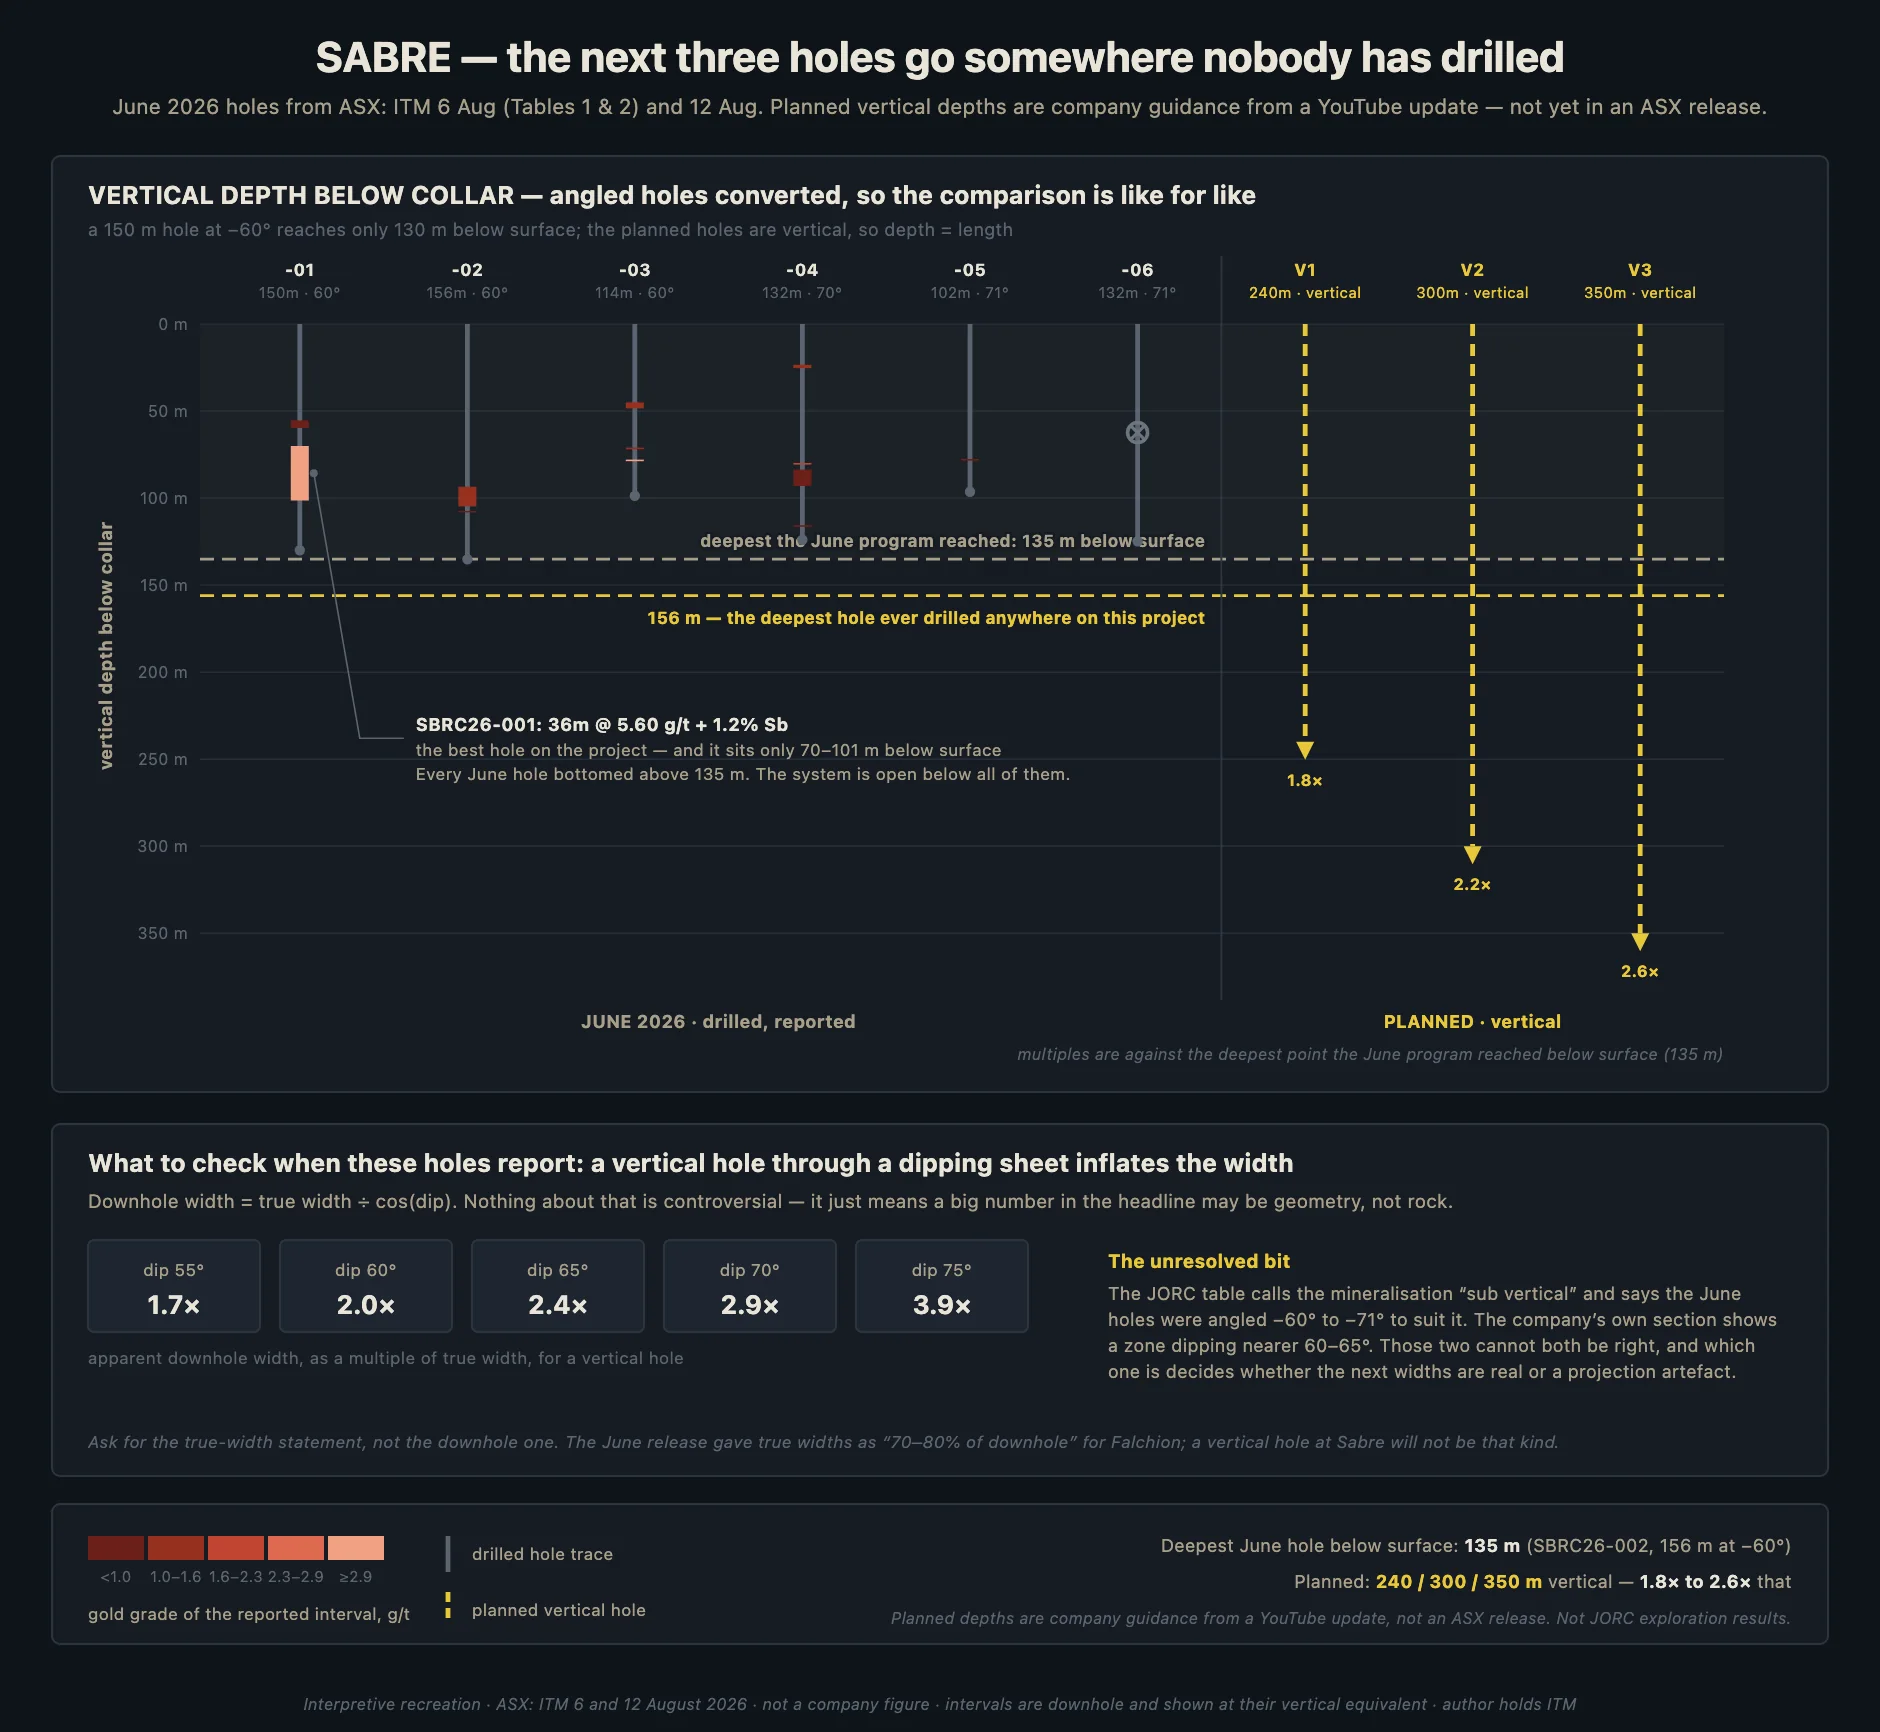
Here is the thing the plan view hides. The deepest hole ever drilled at Sabre is SBRC26-002 at 156 metres downhole, and because it was drilled at 60 degrees it only reaches 135 metres below surface. Every other hole stops shallower. On 791 square kilometres of ground, nothing has ever been tested below 135 vertical metres.
Stage 2, per the MD speaking on the company's own video, is three holes on the same approved pads, drilled vertically on 25 metre spacing, to 240m, 300m and 350m. That roughly doubles the depth ever reached on the project, which is the right instinct.
It also introduces a trap, and it is worth saying now rather than after the assays. If you drill a vertical hole through a steeply dipping structure, the interval you report downhole is wider than the rock actually is. Through a zone dipping at 60 degrees you report double the true width. At 65 degrees, 2.4 times. At 70 degrees, 2.9 times. The company's own JORC table for Sabre calls the mineralisation "sub vertical". If that is right and the holes go straight down, a spectacular downhole number could come back off a structure with very little true width in it. The correct response to the first Stage 2 headline is to find the true width statement before doing anything else. Also worth noting from the same JORC table: the existing holes "deviated significantly", raising by several degrees, which means the plotted collar positions are more reliable than the plotted intercept positions.
Falchion
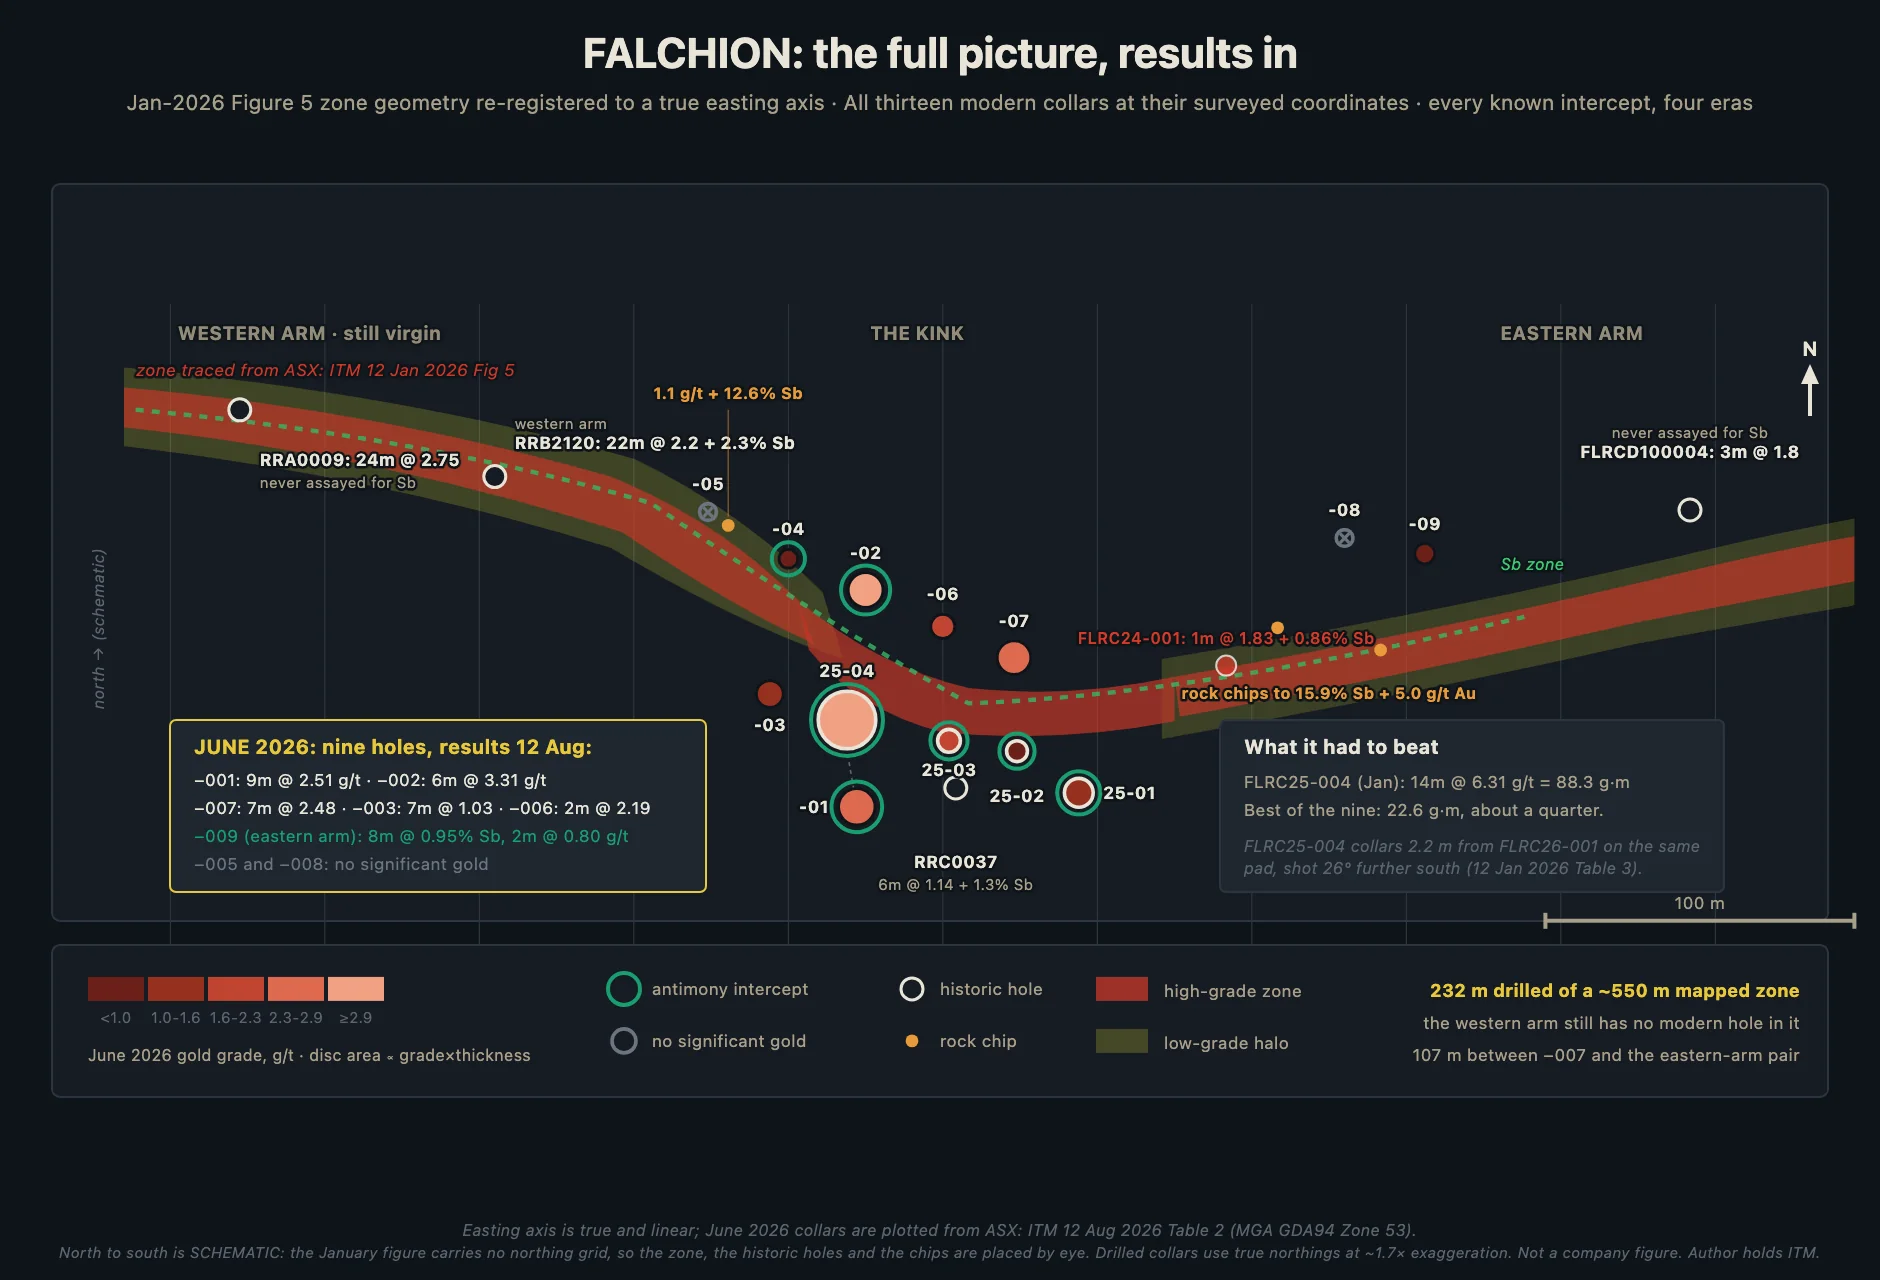
Falchion is the other half of the story and it is the half that got read wrong, including by me. Nine holes went in during June, seven of the nine returned significant gold, and the release was written as a continuation of the 2025 success. It is more complicated than that.
The 2026 program did not step out from the 2025 holes, it re-shot them. Every 2025 collar has a 2026 hole within 33 metres of it, drilled on a new bearing, roughly 190 degrees instead of 215. FLRC26-001 sits 2.2 metres from FLRC25-004, the best hole Falchion has ever produced, shot 26 degrees further south, and stopped at 48 metres where the original went to 90. That is a company testing whether it had the geometry right, not a company extending a discovery. It is a defensible thing to do and it is not what the announcement sounds like.
It mostly worked. FLRC26-007 sits between the FLRC25-001 and FLRC25-002 collars, 33 and 18 metres away, and beat both of them: 17.4 g.m against 10.0 and 1.9. FLRC26-006 landed 22 metres from FLRC25-003 and matched it almost exactly, 5.9 against 6.0. And at the FLRC25-004 pad the new bearing did not come close, 30.2 against 88.3. So the southerly bearing is better across the western trend generally and worse at the one pad that already held the record, which is a real result and not the one the headline implies.
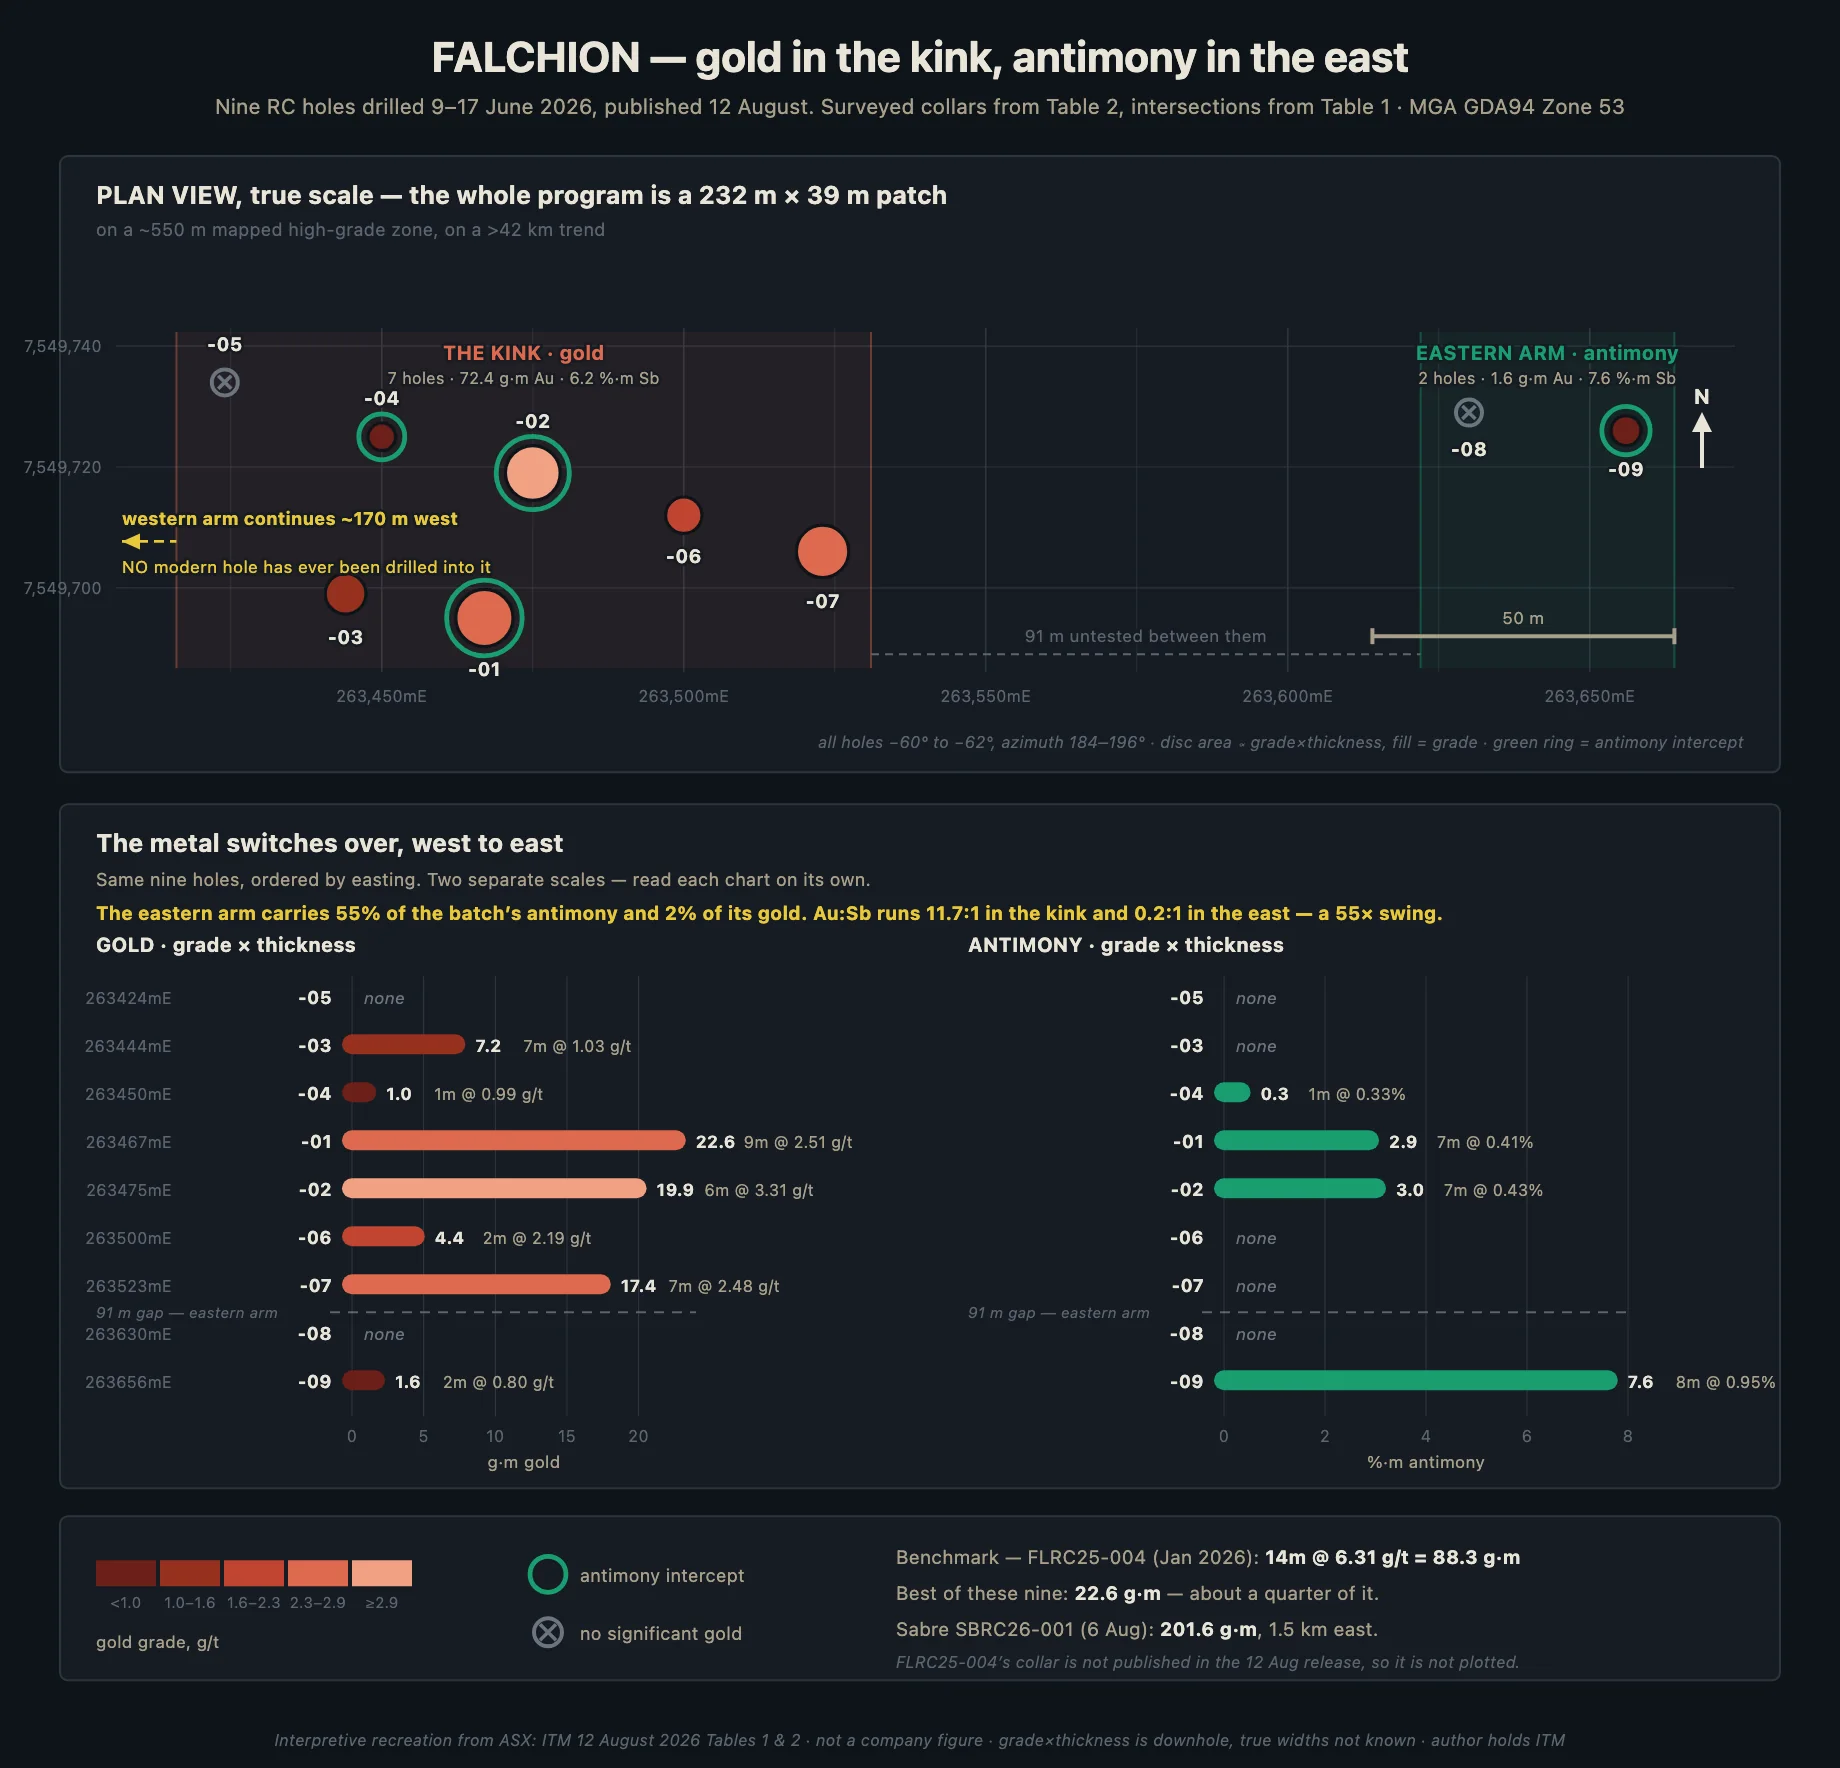
The split that matters at Falchion is east and west, not north and south. I had this backwards in the first version of the working file and the correction is worth stating plainly, because it changes the target.
The main cluster of holes runs from 263424 to 263544 mE. Then there is an 86 metre gap, and then two holes on their own at 263630 and 263656, the eastern arm. Those two behave completely differently to everything west of them. The western cluster runs a gold to antimony ratio around 11.7 to 1. The eastern arm runs 0.21 to 1, a 55-fold swing, and FLRC26-009 came back 8m at 0.95% antimony with only 2m at 0.80 g/t gold beside it. FLRC26-008 returned nothing.
There are three readings of that and I do not think the evidence separates them yet. The eastern arm could be a genuinely zoned part of the same system, antimony rich at one end. It could be the start of a new strike that has not been drilled properly. Or those two holes could simply have missed. Two holes is not enough to choose.
What is not ambiguous is the west. The western trend keeps producing and the western-most collar sits at 263424 mE with nothing beyond it. That is untested ground on the side of the prospect that has consistently worked, and it is the cheapest thing on the whole project to test.
The dolerite angle
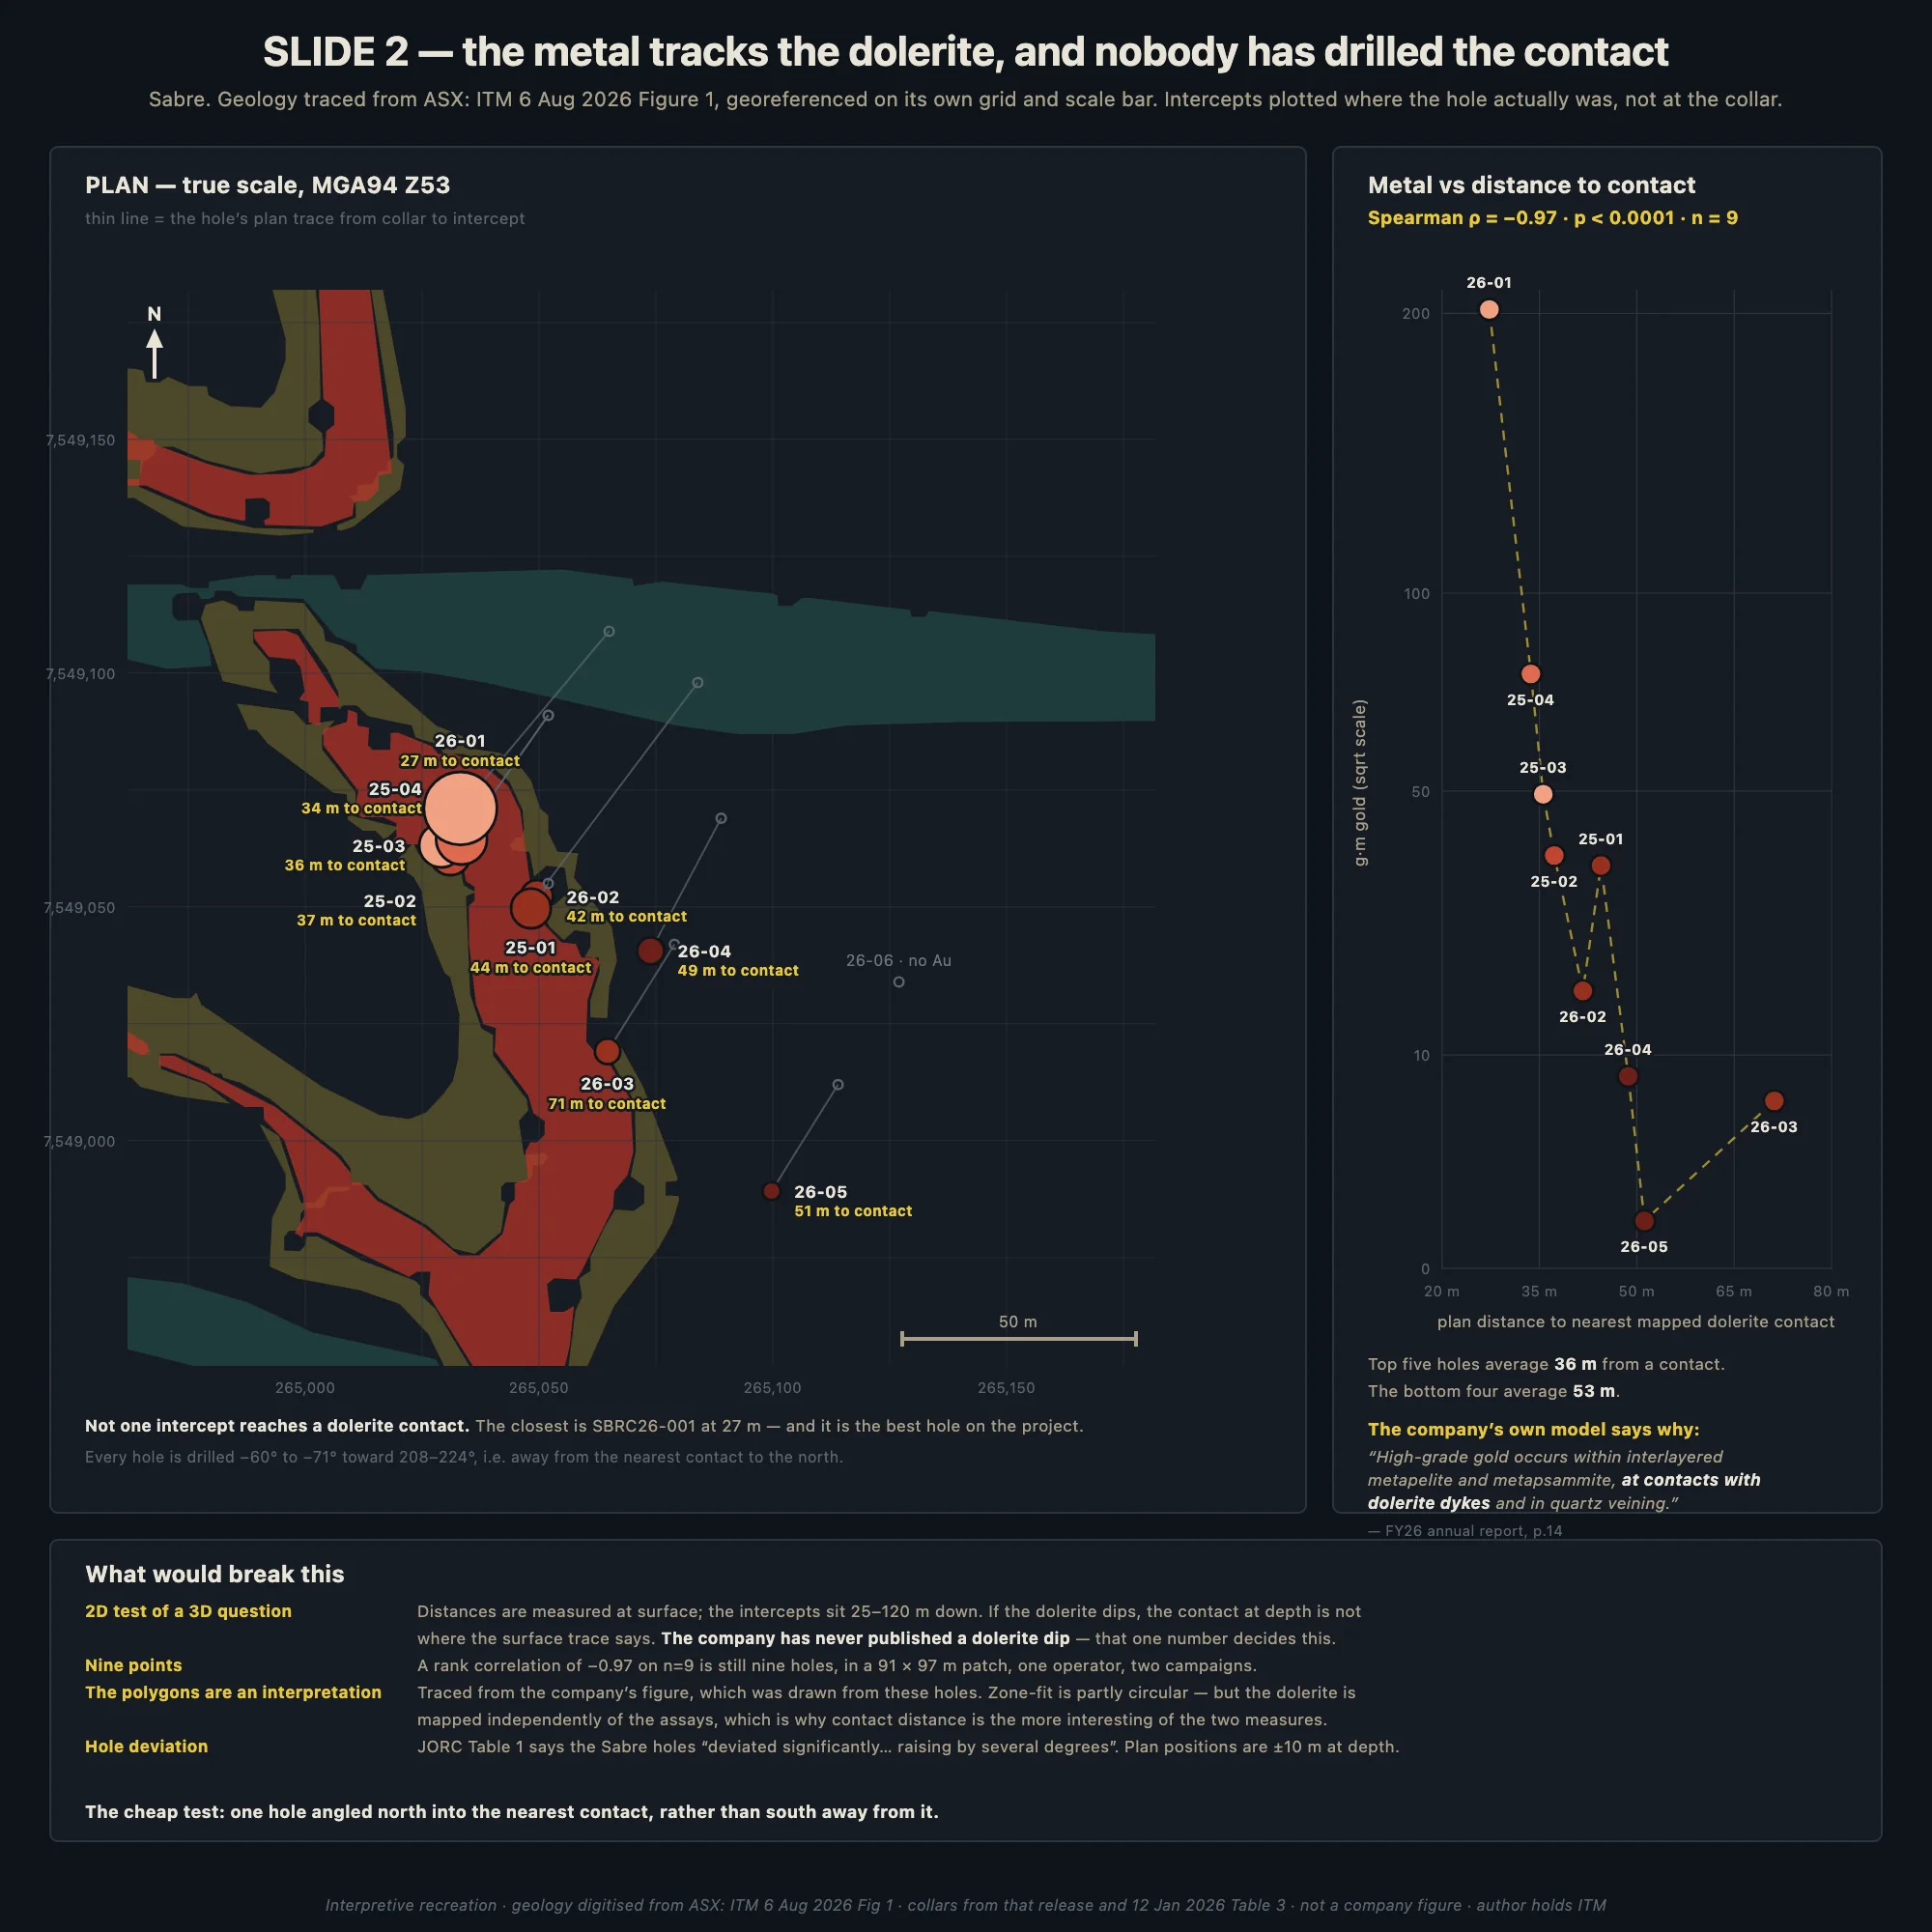
One last thing, and it is a loose end rather than a conclusion.
The FY26 annual report says high grade gold at Reynolds Range occurs "at contacts with dolerite dykes". So I measured it. For the nine Sabre holes with gold, the correlation between grade times thickness and the plan distance from the intercept to the nearest mapped dolerite contact is minus 0.967, with a p value under 0.0001. The best hole on the project, SBRC26-001, is the closest to a contact at 27.3 metres. The worst holes average 53 metres away. And not one intercept on the project has actually reached a contact.
If that holds, it is a drill target with an address.
The reason it is a loose end is that it is a two dimensional test of a three dimensional question. Those distances are measured at surface. The intercepts sit 25 to 120 metres below it. A dyke that is not vertical has migrated sideways by the time you get down to the rock that was assayed, by roughly the vertical depth divided by the tangent of the dip. At 80 metres down that is 21 metres of drift at a 75 degree dip and 46 metres at 60 degrees. Which means the whole finding sits on a hinge: if the dolerite is steep the contact genuinely has never been drilled and the correlation is a target, and if it dips moderately toward the holes then the near holes already reached it at depth and the correlation is telling you that you found the edge of the thing rather than that you have yet to find it.
iTech has never published a dolerite dip. Not in the 6 August release, not in the annual report, not in the JORC table. It is one number, it costs the company nothing to state, and it decides which of those two sentences is the right one. That is the question I would ask them.
The clock
September, results from the remaining 41 or so holes of the 56 hole program. The September quarterly, which is the first to carry the real cost of that program and the first honest look at the burn now that the SQM cheque is behind them. Stage 2 at Sabre, three vertical holes to 240, 300 and 350 metres. 31 August, the 12c options lapse. And somewhere in there, on the Directors' own language about not committing to expenditure without funding in place, a placement.
The falsifiers I am watching, and the day each one trips: a raise priced under 5c, the western trend at Falchion failing to extend on the next set of holes, a Stage 2 headline that quotes a downhole width with no true width beside it, and volume breaking back under 250,000 shares a day, which would mean the 14% that just changed hands has finished changing hands.
Disclosure: I hold ITM at a 4.8c average, marked at 6.0c. I held it before the 6 August release and I hold it now, which is exactly why the sections above spend more time on what the re-drill actually tested and what the margin holes actually found than on the headline grade. Maps and overlays are my own workup from the company's releases and the FY26 annual report. Not advice.